Math Doubts

Sine graph

A diagram that represents the mathematical relation between the angles and the corresponding values of sine function is called the sine graph.

Construction

Positive angles

The values of sine function are repeated for every 360° internal for positive angles. The values of sine function are positive and negative for the positive angles but the sign of values are changed for every 180° degrees interval.
1.

Angles from 0° to 180°

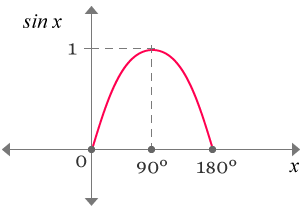
sine graph for angles from 0° to 180°

In this region, the values of sine function are positive but it follows two types of patterns.

  1. At 0°, the value of sine function is 0.
  2. From 0° to 90°, increment takes place in its values. It is continued till 90°.
  3. At 90°, the value of sine function is 1 and it is its maximum value.
  4. After 90°, the values are also positive but decrement takes place in values up to 180°.
  5. At 180°, the value of sine once again comes back to zero.

Sine gives values from 0 to 1 in ascending order from 0° to 90°. It gives same values from 90° to 180° but the values are in descending order.
2.

Angles from 180° to 360°

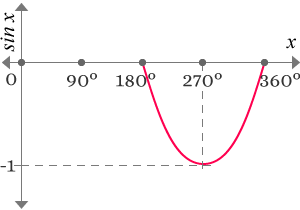
sine graph for angles from 180° to 360°

In this region, the values of sine function are negative and it also follows two types of patterns.

  1. The decrement in its values is continued even after 180° and ended at 270°.
  2. At 270°, the value of sine function is minimum and it is -1.
  3. From 270°, the increment in sine values takes place and it is continued till 360°.
  4. At 360°, the value of sine is once again 0.

The sine function’s values are decreased from 0 to -1 for the angles from 180° to 270° but its values are increased from -1 to 0 for the angles from 270° to 360°.

sine graph for angles from 0° to 360°

Combine both graphs to understand its behavior for the positive angles from 0 to 360 degrees.

  1. From 0° to 90°, the values are positive and in ascending order.
  2. From 90° to 180°, the values are positive but in descending order.
  3. From 180° to 270°, the values are negative and in descending order.
  4. From 270° to 360°, the values are negative but in ascending order.

It is a graph between angles and respective values of sine function for the angles from 0° to 360°.

sine graph for positive angles°

The same graph is repeated for every next 360 degrees interval in positive angle region.

Negative angles

The values of sine function are also represented for each 360° internal for negative angles. The values of sine function are also positive and negative for the negative angles but the sign of the values are also changed for each 180° interval.
1.

Angles from 0° to -180°

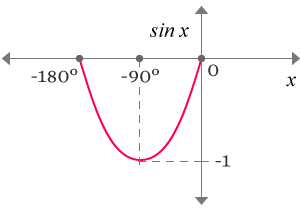
sine graph for angles from 0° to -180°

In this region, the values of sine function are negative but it follows two types of patterns.

  1. At 0°, the value of sine function is 0.
  2. From 0° to -90°, decrement takes place in its values and it is continued up to -90°.
  3. At -90°, the value of sine function is minimum and it is -1.
  4. After -90°, sine changes its functionality and increases its values up to -180°.
  5. At -180°, the value of sine function is zero.

The values of sine are decreased from 0 to -1 for the angles from 0° to -90° but increased from -1 to 0 for the angles from -90° to -180°.

2.

Angles from -180° to -360°

sine graph for angles from -180° to -360°

In this region, the values of sine function are positive but it also follows two types of patterns.

  1. From -180°, sine follows same functionality by the gradual increment in its values.
  2. At -270°, the value of sine is 1 and maximum.
  3. Sine changes its functionality at -270° and gives values which are gradually decreased till -360°.
  4. At -360°, the value of sine is 0.

The values of sine are increased from 0 to 1 for the angles from -180° to -270° but it gives its values from 1 to 0 for the angles from -270° to -360°.

Math Questions

The math problems with solutions to learn how to solve a problem.

Learn solutions

Math Worksheets

The math worksheets with answers for your practice with examples.

Practice now

Math Videos

The math videos tutorials with visual graphics to learn every concept.

Watch now

Subscribe us

Get the latest math updates from the Math Doubts by subscribing us.

Learn more

Math Doubts

A free math education service for students to learn every math concept easily, for teachers to teach mathematics understandably and for mathematicians to share their maths researching projects.

Copyright © 2012 - 2023 Math Doubts, All Rights Reserved